Does Canada Have the Future of Avalanche Forecasting?
Canada is bigger than America. Sore as many Americans may be about this fact, it just is. It’s 3.85 million square-miles versus 3.79 million. So take that, Yankees, along with Canada’s one-to-zip tally of war wins (1812, look it up).
But, two centuries later, here’s the rub: There are now 325.9 million people in the U.S. compared to 38.1 million in Canada. With a population density similar to Europe’s, the U.S. has 10 times more people in it than Canada. That means way more services—and way more data—and this is where Canada starts to lose out. In the world of avalanche forecasting, all that empty vastness produces a scarcity of information that’s a really big conundrum to work with. There are 117 avalanche warning regions in Switzerland, for example—a country that could fit inside many of the 16 avalanche forecasting regions in Canada. And those 16? They’re almost all in one province.
The ace up The Great White North’s sleeve in this regard has always been something called the InfoEx, which is the largest avalanche database in the world. Because the province of British Columbia—which comprises most of Canada’s mountain west—has such a big number of backcountry heli-, cat- and ski-touring operations, the Canadian Avalanche Association is able to pool all those outfits’ snowpack observations into one place. And Avalanche Canada, the country’s public forecasting agency, is then able to use it to make forecasts and bulletins. (Parks Canada, a federal agency, does its own forecasting in places like Rogers Pass and Banff.)
But what happens when a lot of the data going into the InfoEx disappear, say, as a result of a global pandemic that shuttered or reduced operations? While the current situation may not have been the impetus for such forward thinking, Avalanche Canada was prepared nonetheless. To account for data holes, Avalanche Canada has been innovating a solution since its inception that successfully helped bridge the gap during the winter of 2021: synthetic snowpack modelling.
The technology has existed for a long time that inputs data from weather stations into modelling software (thank you, Switzerland). However, because Canada has way less telemetry than its politically neutral European benefactor, they had to innovate the innovation. Instead of using weather station inputs, Avalanche Canada has developed technology that produces a model based on the weather forecast. This allows them to see what the model’s algorithm predicts what the snowpack will look like.
The big question then becomes how accurate that is. The answer is about as accurate as the weather forecast, according to Karl Klassen, Avalanche Canada’s public avalanche warning service manager.
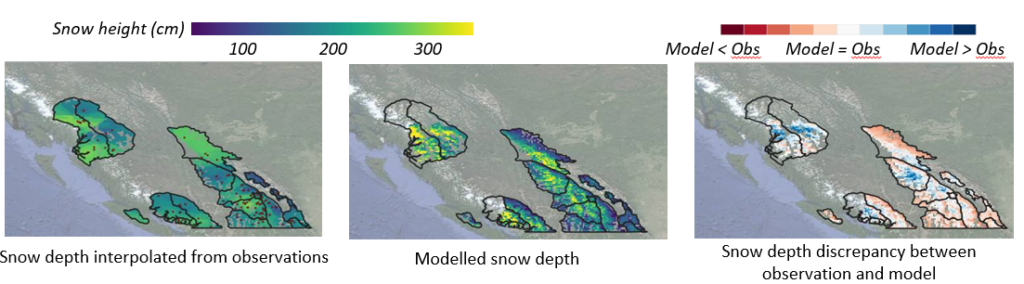
“We’ve spent quite a bit of time comparing what the model says the snowpack should look like based on the forecast and what we see in the field,” he explains. “It’s certainly not 100 percent accurate, but it gets better every year. We’re to the point now where, especially in data-sparse regions where we don’t have a lot of information from the ground, we feel like the model is our next best educated guess about what’s going on in the snowpack.”
For anyone worried about the machines becoming self-aware, take a step back. There’s no AI at work here; these are algorithms that humans use to help write a very human-compiled bulletin. That bulletin may be informed by the InfoEx, field-team observations (Avalanche Canada has five), or the synthetic model built from the weather forecast. It’s just one more data point for the people interpreting that data, the forecasters, to look at. At the end of the day, actual experts still choose how much confidence to have in it. But increasingly each year, when Avalanche Canada compares this modelling to hard field observations, it gets sharper and sharper.
“We trust it,” Klassen continues. “We use it operationally, it’s a tool. We don’t look at it and say, ‘That’s what the snowpack is doing.’ We say ‘Oh, there’s another opinion about what the snowpack is doing.’ But the opinion is coming from a machine instead of a person.”
Klassen admits the pandemic accelerated this technology’s implementation, and that as a result, Canada is likely at the leading edge of putting it into practice. While other jurisdictions are researching and testing modelling, Avalanche Canada is actually using it. In following, Colorado and Norway, two jurisdictions with low population density, are watching with great interest.
“My counterpart in Norway [Rune Engeset] said within a few years he thinks avalanche forecasts will be produced by models, and avalanche forecasters will simply be communicating to the public,” Klassen recounts.
For his part, Klassen is much more cautious, stating that snowpack modelling is in its infancy. He thinks that in places where there’s sparse information and reliable weather forecasts, it could become the primary data point. But nobody’s giving up human observations anytime soon.
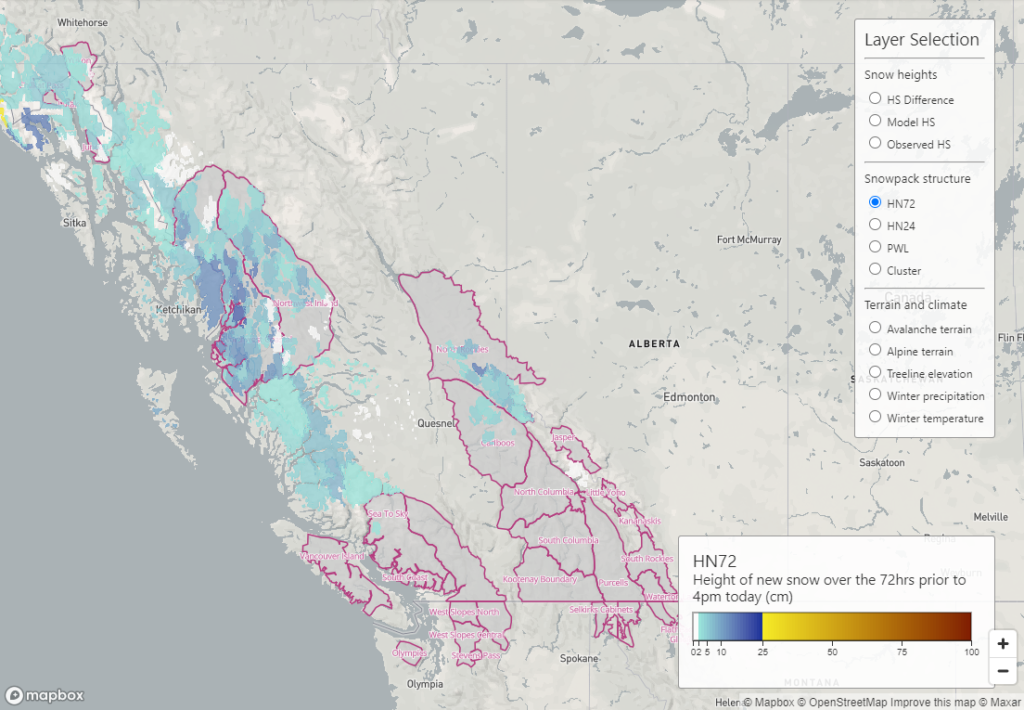
The other cool benefit to the new technology is an interface built by Simon Horton. He’s a forecaster and developer at Avalanche Canada, but he also holds a PhD from Simon Fraser University in avalanche mechanics. His app displays the model geospatially, at a much more granular level than any other data set provides.
“We’re not the first or only people to use the weather forecast, but no one’s developed it beyond trials,” Horton explains. “It’s very similar conceptually to weather forecast models. A lot of our developments have been more on the visualization end.”
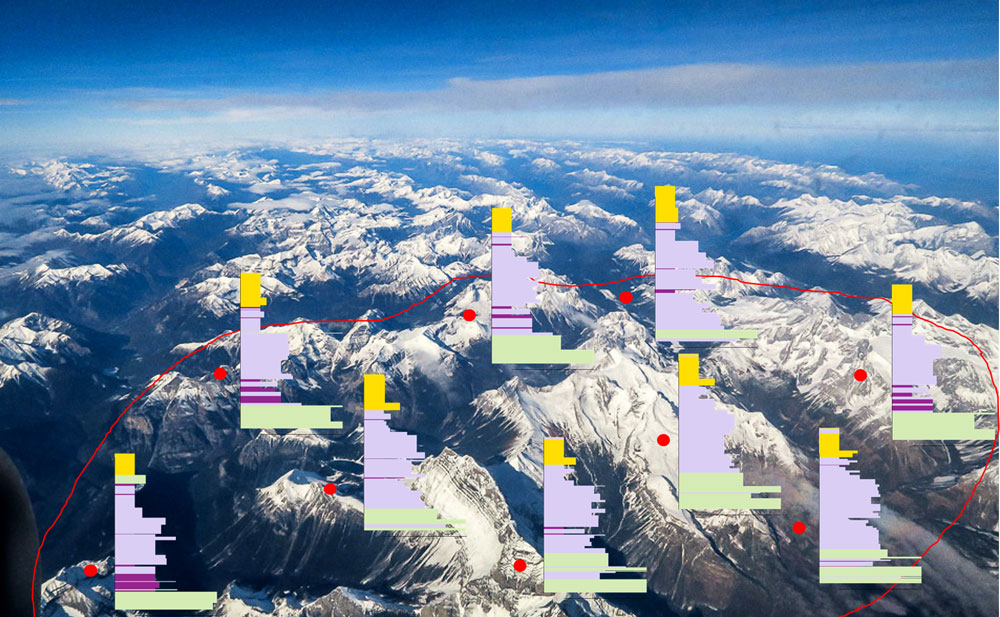
What that does is break down massive forecasting regions, like British Columbia’s North Columbia, into smaller squares of 10 kilometres or so and creates a grid. The grid then displays similar snowpacks in similar colors, and what you get is a heatmap of modeled avalanche problems.
“I look at it every day, but not too long,” Horton says. “You can use it to parse out differences in a region. For example, we have a lot of observations in the north Purcell [Mountains], but not the south. If the model shows it’s similar in the north and south, you can make an extrapolation.”
Horton says the situations in which the app (which is only used internally at Avalanche Canada for now) is the most helpful are when things are changing quickly. Given that change is the one constant in life, that’s a comforting thought. As is the idea that, if you’ve been dreaming of moving somewhere secluded to earn your turns in peace, avalanche bulletins have your back more than ever.
Matt Coté is a writer and editor who calls Revelstoke, B.C., home. He generally muses about things that happen in the mountains, which have occupied a central place in his life since he was a little kid. He’s a devout Canadian, and his spirit animal is Justin Bieber.